
3 tips for weathering the market's bumpy ride
A very interesting graph comparing short term volatility with past long term reality.

If the recent US stock market gyrations have your head spinning, you’re not alone. With major indices swinging up and down daily, it’s easy to understand why investors might be feeling a bit seasick.
Three thoughts that might help:
- Maintain perspective. You’re not imagining things. The markets have been more volatile lately. But you may be surprised to learn that the increased volatility brings us closer to the historical norm. Investors may have anchored their expectations to the lower-than-normal volatility we experienced back in 2017. (See chart below.)
- Don’t do anything rash. If you’ve been invested for years in a broad, diversified mix of stocks and bonds, your portfolio likely has appreciated. And the risk of timing an investment decision poorly is generally higher than the risk of changing nothing at all in your portfolio. Remember, it’s also a decision to do nothing.
- Check your asset allocation. If market movements have meaningfully altered the ratio of stocks, bonds and other asset classes in your investment plan, it may make sense to do some rebalancing.
If all this sounds rather familiar and you’re not especially concerned about the market’s fluctuations, I say: thanks for reading.
Don’t let turbulence distract you: keep your focus on the longer term.
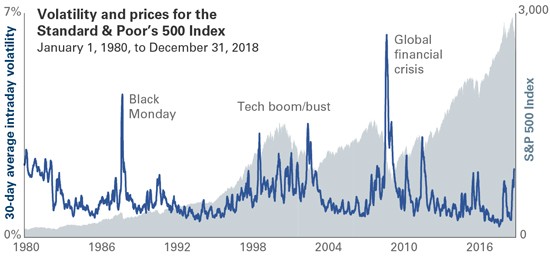
Notes: Intraday volatility is calculated as daily range of trading prices [(high-low)/opening price] for the S&P 500 Index.
Vanguard Chief Investment Officer Greg Davis offers perspective on recent market movements.
Sources: Vanguard calculations, using data from Bloomberg.
15 January 2019
Information on this website is based on current regulatory requirements and laws, which may be subject to change. While care has been taken in the preparation of this information, no liability is accepted by Count, its related entities, agents and employees for any loss arising from reliance on information within.